Quant Risks Decline As It Faces Two Rejections At $110

The price of Quant (QNT) has started a sideways trend below the $110 resistance level. Cryptocurrency price Analysis by Coinidol.com.
Quant Price Long Term Prediction: Bullish
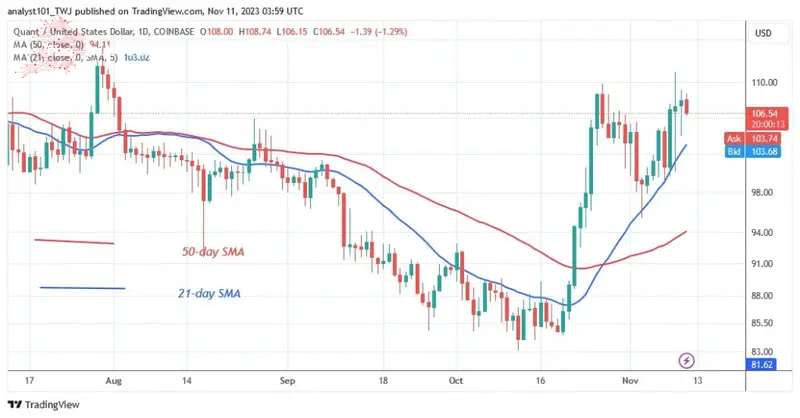
The $110 resistance marked the end of the previous upswing. The price of Quant has been fluctuating between $96 and $110 since October 26. As the market is approaching the overbought zone, it is unlikely that the cryptocurrency will rise much higher. The historical price level from July 29, but then Quant was under selling pressure.
Today, on November 11, the QNT/USD pair is trading at $106. If the current support is broken, QNT will come under selling pressure again. The market will fall to $85, which is its low.
Quant Price Indicator Analysis
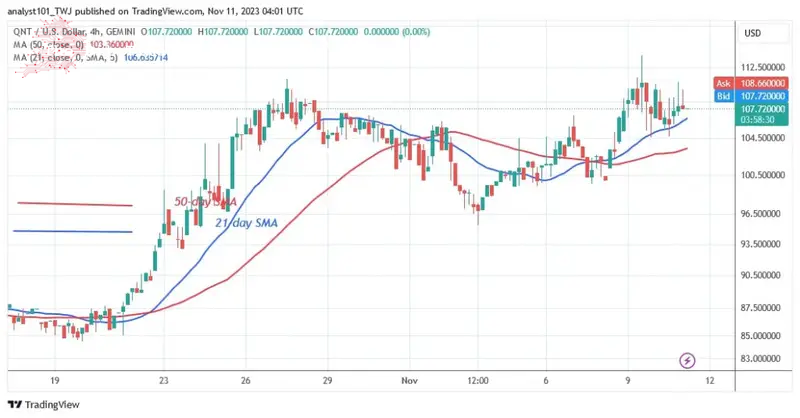
The sloping moving average lines are above and below the price bars. This indicates that the current rally has ended and the market is moving in a range. The moving average lines indicate that the altcoin is retracing its steps. The value of the coin will drop if it falls below the moving average lines.
Technical indicators
Key supply zones: $140, $150, $160
Key demand zones: $90, $80, $70

What is the next move for Quant (QNT)?
The cryptocurrency is in an uptrend, but it could fall. The market has reached an overbought zone between $110 and $115. Since July 30, the bulls have failed to extend their bullish momentum above the overbought area of the market. On the upside, the range could continue or there could be an abrupt decline.
On November 6, Coinidol.com reported that QNT/USD was trading at $100.26.

Disclaimer. This Analysis and forecast are the personal opinions of the author and are not a recommendation to buy or sell cryptocurrency and should not be viewed as an endorsement by CoinIdol.com. Readers should do their research before investing in funds.
Comments
Post a Comment